 ar
ar bg
bg hr
hr cs
cs da
da nl
nl fi
fi fr
fr de
de el
el hi
hi it
it ko
ko no
no pl
pl pt
pt ro
ro ru
ru es
es sv
sv tl
tl iw
iw id
id lv
lv lt
lt sr
sr sk
sk sl
sl uk
uk vi
vi et
et hu
hu th
th tr
tr fa
fa ms
ms hy
hy ka
ka ur
ur bn
bn mn
mn ta
ta kk
kk uz
uz ku
ku
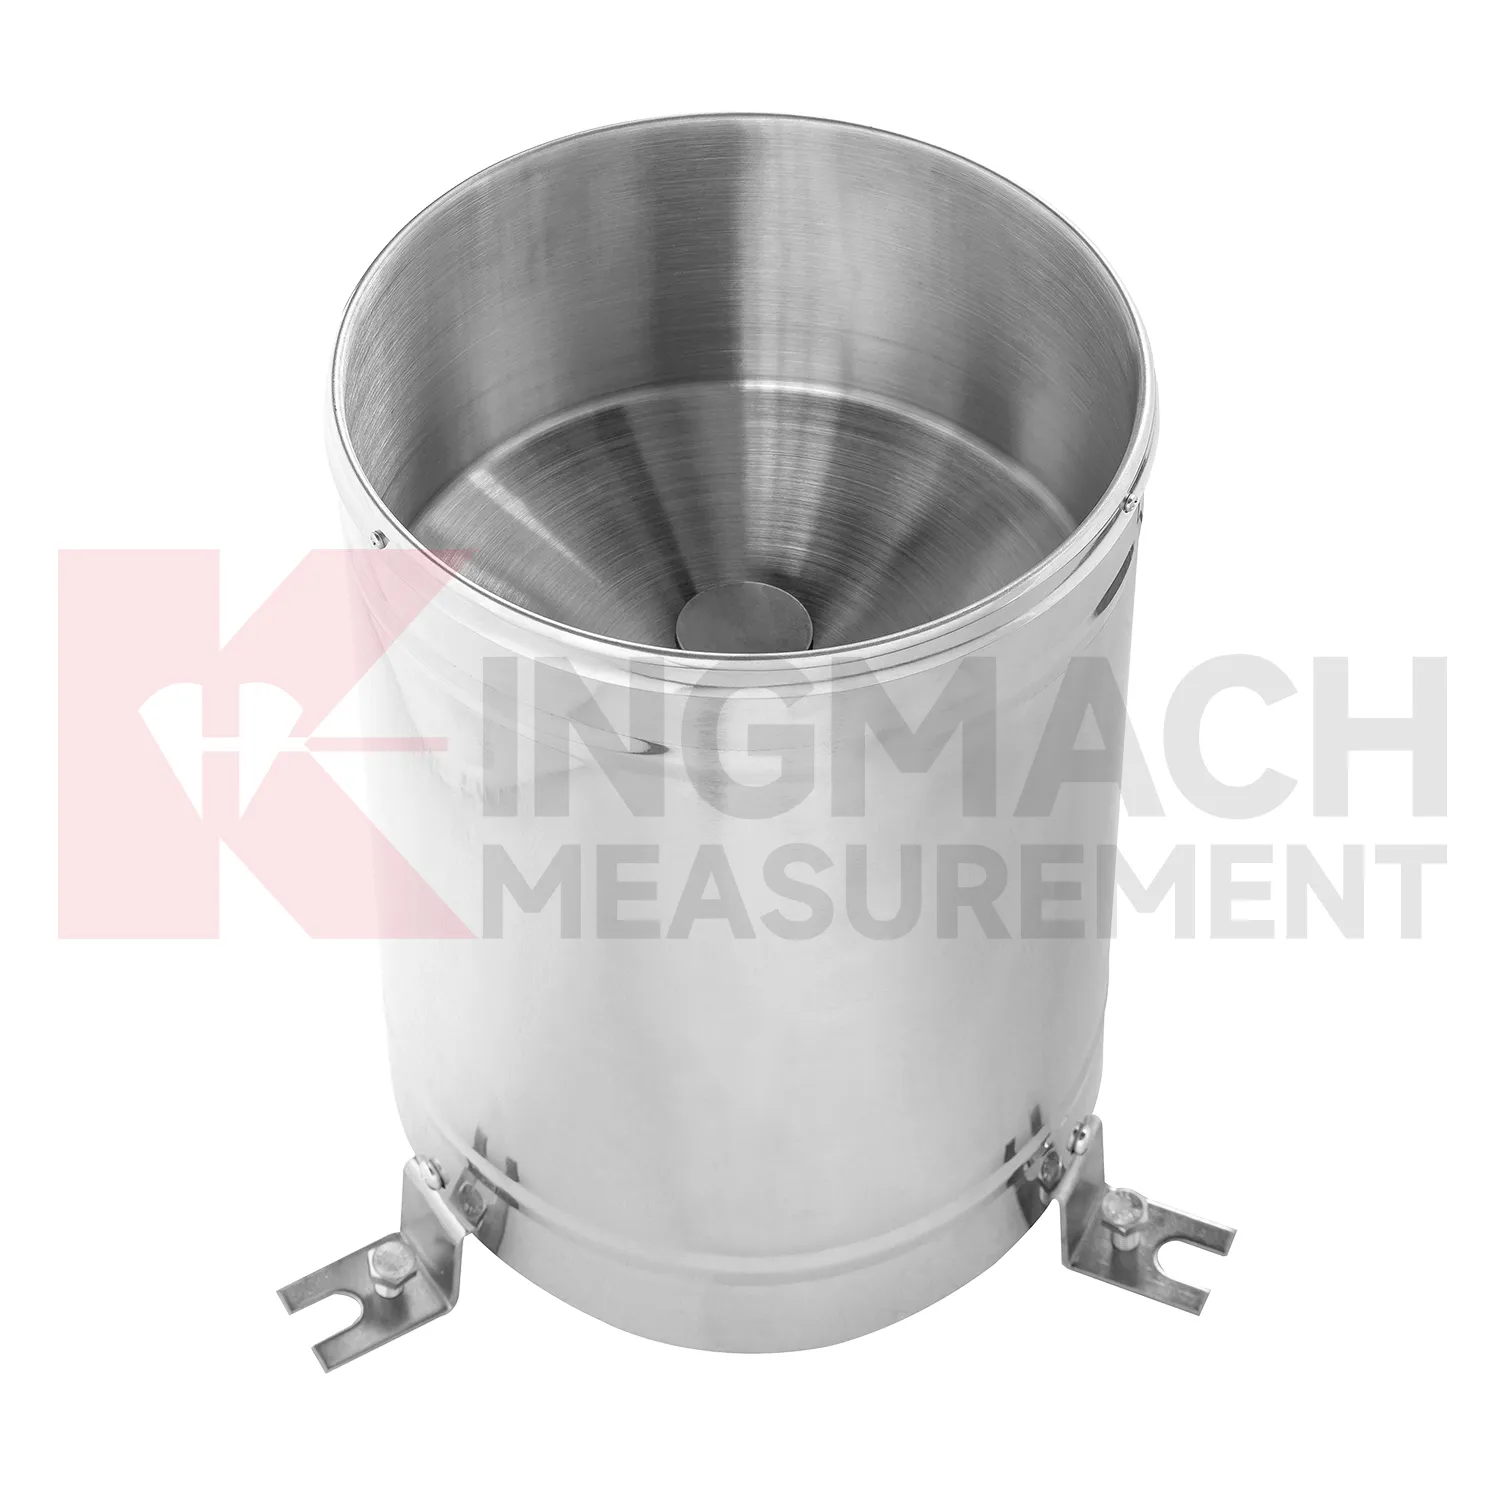
tipping rain bucket gauge
Rainfall monitoring in Kingmach tipping rain bucket gauge provides the time record behind many water-related engineering events. A rain point should be open to the sky, level, clean, and protected from splash, leaves, dust, and nearby obstructions. The data is useful because it turns a storm into a dated sequence that can be compared with slope movement, seepage, runoff, settlement, pore pressure, tunnel leakage, or construction delays. Long-term rainfall records also help owners understand seasonal behavior. A small storm after many wet days may create more response than a larger storm after dry weather. A well-maintained rainfall record helps explain that difference. For reports, the most useful information is not only the total rain amount, but also timing, duration, intensity pattern, and whether related ground or structural sensors changed afterward.
During abnormal events, the first question is not only whether the value crossed a limit. The reviewer should ask what changed around the site, whether the related structure reacted, and whether a field inspection confirmed the same pattern.
Long-term value comes from consistency. A channel that keeps the same location, unit, maintenance history, and linked asset record can support seasonal comparison, post-storm review, and handover between construction and operation teams.
Maintenance teams should record cleaning, access difficulty, enclosure condition, cable repair, vegetation growth, nearby equipment changes, and the first normal reading after work. Those notes protect the meaning of the curve when old data is reviewed months later.
Application of tipping rain bucket gauge
Agriculture and irrigation projects use Kingmach tipping rain bucket gauge to understand the relation between rainfall, irrigation, soil wetness, air conditions, and plant or ground response. The purpose is not just to display weather information. The record should help managers decide when soil is drying, whether irrigation reached the intended depth, whether rainfall replaced a scheduled watering event, and how greenhouse or field conditions changed over time. Probe depth, soil type, crop zone, irrigation schedule, and cable route should be recorded at installation. Air temperature and humidity can be reviewed with soil wetness to understand drying speed and growing conditions. A consistent environmental record supports practical water management and helps avoid decisions based only on surface appearance.
Maintenance teams should record cleaning, access difficulty, enclosure condition, cable repair, vegetation growth, nearby equipment changes, and the first normal reading after work. Those notes protect the meaning of the curve when old data is reviewed months later.
The environmental point should be part of a named monitoring question. It may explain wetting, drying, wind exposure, thermal movement, cabinet stress, or pressure variation, but that purpose needs to be visible in drawings and reports.
If the reading seems unusual, the team should check the physical condition of the station before drawing conclusions about the asset. Blockage, poor exposure, loose wiring, water entry, and changed surroundings can all create misleading patterns.
The future of tipping rain bucket gauge
Wind context will become a stronger part of future Kingmach tipping rain bucket gauge for bridges, towers, airports, marine structures, and high buildings. Wind speed alone is often not enough; direction, gust timing, pressure, temperature, and structural response all matter. Future platforms should connect wind records with acceleration, tilt, displacement, strain, and inspection events. When vibration rises, the reviewer can quickly judge whether it matched known exposure or points to a separate issue. This will improve confidence during storms and high-wind periods. It will also help owners decide when to schedule inspection, restrict access, or compare present response with earlier events.
Wind-event records should also keep exposure notes, station height, nearby obstructions, and maintenance access visible. A sensor mounted on a roof edge, bridge tower, airport mast, or coastal structure may see very different airflow from a sheltered point nearby. Future reporting should make that difference clear so teams do not compare unrelated wind records as if they represent the same condition.
For long-term review, repeated wind events can become a useful operating history. Owners can compare similar wind directions across seasons, check whether structural response remains stable, and decide whether an inspection is needed after a severe event. That turns wind monitoring into a maintenance planning tool rather than only a weather record.
Care & Maintenance of tipping rain bucket gauge
Data review is part of maintaining Kingmach tipping rain bucket gauge. Look for impossible values, flatlines, repeated spikes, missing intervals, unit mistakes, and disagreement between related channels. Rainfall should have a plausible relation to wetting; wind pressure should be reviewed with wind exposure; humidity changes should match room or cabinet conditions. If a structural alarm occurs, environmental records should be checked before the team concludes that the structure changed. A good review compares time stamps, site events, maintenance logs, and nearby instruments. This habit keeps environmental records believable and turns them into a reliable part of engineering review.
Review work should also separate data-quality questions from engineering questions. A strange value may come from a blocked rain point, sheltered wind path, wet connector, moved cabinet, or changed unit setting. The reviewer should clear those possibilities before treating the record as a site condition.
Monthly checks can include a short data-quality note that lists missing intervals, unusual values, repaired points, and channels needing field inspection. This makes the environmental network easier to manage and keeps abnormal-event reports from being built on weak records.
Kingmach tipping rain bucket gauge
A Kingmach tipping rain bucket gauge station should be planned as a small field system. The rain point needs open exposure and level installation. The wind point needs representative airflow rather than shelter behind a wall. A soil probe needs firm contact at a meaningful depth. A humidity point needs to represent the room, tunnel, cabinet, or work zone being monitored. Power, cables, connectors, enclosure protection, and communication channels matter because poor field setup can create misleading records. The station drawing should show where each condition is measured and why that position was chosen. This makes later review easier when the site changes, a cabinet is moved, or a reading no longer matches surrounding conditions.
Long-term value comes from consistency. A channel that keeps the same location, unit, maintenance history, and linked asset record can support seasonal comparison, post-storm review, and handover between construction and operation teams.
Maintenance teams should record cleaning, access difficulty, enclosure condition, cable repair, vegetation growth, nearby equipment changes, and the first normal reading after work. Those notes protect the meaning of the curve when old data is reviewed months later.
FAQ
Q: What maintenance does Kingmach tipping rain bucket gauge need?
A: Maintenance includes cleaning, leveling, exposure checks, cable inspection, enclosure checks, unit verification, and data-quality review.
Q: What should be checked after storms?
A: Check rain catchment, cabinet water entry, cable damage, wind mounting, soil-point disturbance, and the first stable data after inspection.
Q: What causes misleading records?
A: Poor placement, blocked catchment, sheltered wind exposure, weak soil contact, water in cabinets, channel swaps, or missing maintenance notes can mislead reviewers.
Q: How often should inspections happen?
A: Frequency depends on exposure, asset risk, access, weather season, and how strongly the environmental data affects engineering decisions.
Q: How should replacement be handled?
A: Record the old and new condition, date, reason, point photo, channel change, and first stable value after replacement.
The environmental point should be part of a named monitoring question. It may explain wetting, drying, wind exposure, thermal movement, cabinet stress, or pressure variation, but that purpose needs to be visible in drawings and reports.
Reviews
David Wilson
We purchased displacement transducers and settlement sensors, and the quality exceeded our expectations. Easy installation and reliable performance.
Michael Anderson
The strain gauges and load cells are extremely accurate and stable. They performed very well in our bridge monitoring project. Highly recommended!
Latest Inquiries
To protect the privacy of our buyers, only public service email domains like Gmail, Yahoo, and MSN will be displayed. Additionally, only a limited portion of the inquiry content will be shown.
Amelia***@gmail.comSingapore
Hello, I am looking for visualization software for monitoring system data analysis. Please let me kn...
Charlotte***@gmail.comUnited Arab Emirates
Hi, we require instrumentation cables suitable for harsh environments. Could you advise on specifica...
Related product categories
- resistance of temperature sensor
- Temperature and Humidity Acquisition Module
- water temperature sensor resistance
- soil moisture sensor
- soil moisture sensors
- capacitive soil moisture sensor
- best soil moisture sensor
- capacitive soil moisture sensors
- sensor soil moisture
- soil moisture sensor reviews
- capacitive soil moisture sensor v1 2
- resistive soil moisture sensor