 ar
ar bg
bg hr
hr cs
cs da
da nl
nl fi
fi fr
fr de
de el
el hi
hi it
it ko
ko no
no pl
pl pt
pt ro
ro ru
ru es
es sv
sv tl
tl iw
iw id
id lv
lv lt
lt sr
sr sk
sk sl
sl uk
uk vi
vi et
et hu
hu th
th tr
tr fa
fa ms
ms hy
hy ka
ka ur
ur bn
bn mn
mn ta
ta kk
kk uz
uz ku
ku
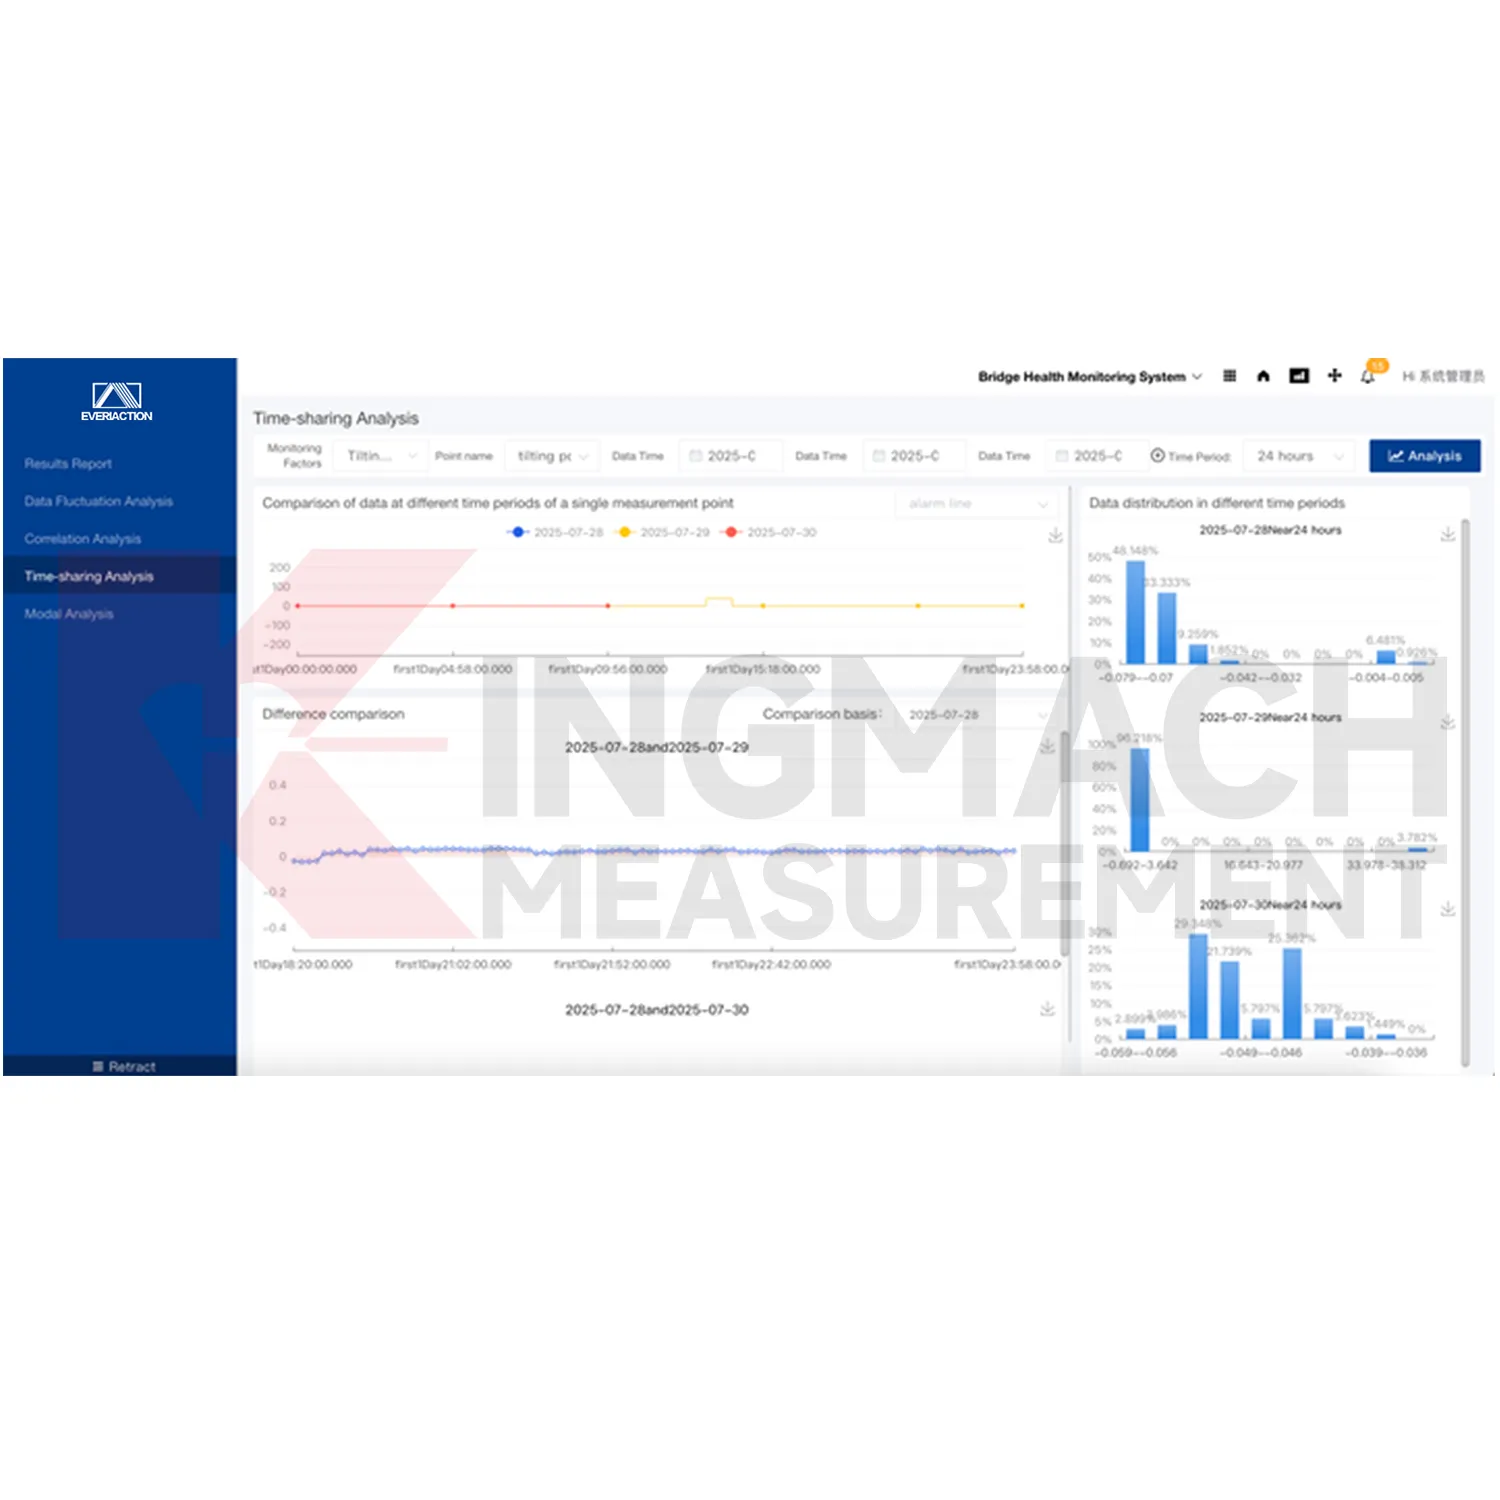
Visualization Software
The Monitoring system software platform can build structural safety models and support intelligent detection and health analysis. The local product file describes the use of formulas, algorithms, and manual research and judgment methods to determine the location and extent of structural damage. This makes the platform useful when monitoring data must support engineering interpretation instead of simple storage. The software can warn of changes in structural performance and help reviewers connect abnormal readings with a specific asset area, sensor group, or inspection record.
Application of Visualization Software
Foundation pit monitoring uses Kingmach Visualization Software to coordinate support force, displacement, settlement, groundwater, tilt, and environmental records during construction. Pit sites change quickly, and data must be reviewed alongside excavation stage, support installation, rainfall, pumping, and nearby building response. Flexible alarm rules help the team distinguish routine stage-related movement from a reading that needs inspection. Project documents and dynamic information also help later reviewers understand what was happening when a trend changed.
The future of Visualization Software
Future use of Kingmach Visualization Software will grow as civil engineering monitoring moves from isolated instrument readings to connected asset management. More structures will rely on sensors, acquisition modules, wireless devices, and cloud platforms to maintain a continuous safety record. The software layer will become the place where owners review not just one reading, but the relationship between trends, alarms, inspections, weather, construction, and maintenance work. A platform that integrates multiple data sources will be central to that shift.
Care & Maintenance of Visualization Software
After software updates or configuration changes, Kingmach Visualization Software should be checked with a short acceptance routine. Confirm device connections, data storage, trend display, alarm rules, report generation, user access, and project document links. Compare a few channels with field records or acquisition device values to make sure nothing shifted during the update. Record the date, change type, user, and verification result. This keeps platform maintenance visible in the project history.
Kingmach Visualization Software
Kingmach Visualization Software makes reporting easier because monitoring evidence is already organized by project, device, channel, trend, alarm, and document. Registered experts can issue professional result reports through the platform workflow described in the local product file. For owners, reports need to explain what changed, where it happened, which instruments confirmed it, and what field action followed. A platform that stores data, filters records, generates visual trends, and keeps project documents together makes that reporting process more traceable than manual consolidation after the event.
FAQ
Q: How are trend curves used?
A: They help compare current readings with earlier behavior so gradual movement, sudden jumps, or event response can be reviewed.
Q: What does real-time filtering help with?
A: It reduces noisy or distracting records before users study the channel history.
Q: How do alarms guide action?
A: Configured rules point users toward the affected point, severity level, time, and related follow-up record.
Q: What makes reports easier?
A: Stored trends, alarms, project files, and expert review notes can be gathered without rebuilding the evidence manually.
Q: Why is graphical display useful?
A: Graphs help users see movement direction, timing, and abnormal patterns faster than raw tables alone.
Reviews
Andrew Lee
The visualization software is intuitive and powerful. It helps us analyze monitoring data efficiently.
Robert Taylor
The weir flow meter is well-built and delivers accurate measurements. Great value for water management applications.
Latest Inquiries
To protect the privacy of our buyers, only public service email domains like Gmail, Yahoo, and MSN will be displayed. Additionally, only a limited portion of the inquiry content will be shown.
Harper***@gmail.comIndia
Dear Sir, we are planning to procure a complete monitoring system including strain gauges, tiltmeter...
Isabella***@gmail.comGermany
Hello, we are evaluating weir flow meters for a water management project. Please share accuracy deta...
Related product categories
- Monitoring Software Suite
- Monitoring system software platform
- Environmental Monitoring
- Visualization Software
- GPS Displacement Monitoring System
- Integrated Monitoring Station
- Settlement Monitoring Rod
- Structural Health Monitoring (SHM) System
- Structural Monitoring Cloud Platform
- IoT Online Monitoring System
- Monitoring System Platform & Services
- Engineering Pulse Intelligent Monitoring Cloud Platform