
 EN
EN
 ar
ar bg
bg hr
hr cs
cs da
da nl
nl fi
fi fr
fr de
de el
el hi
hi it
it ko
ko no
no pl
pl pt
pt ro
ro ru
ru es
es sv
sv tl
tl iw
iw id
id lv
lv lt
lt sr
sr sk
sk sl
sl uk
uk vi
vi et
et hu
hu th
th tr
tr fa
fa ms
ms hy
hy ka
ka ur
ur bn
bn mn
mn ta
ta kk
kk uz
uz ku
ku
Environmental Monitoring
Wind monitoring in Kingmach Environmental Monitoring helps explain dynamic response and site exposure on bridges, towers, airports, marine facilities, tunnel portals, urban stations, and wind-sensitive construction areas. Wind values are most useful when the station placement represents the asset being reviewed. A sensor behind a wall or below a sheltered deck may produce neat data but fail to explain the structure. Engineers often need to know direction as well as speed because crosswind, headwind, gusts, and local shielding create different responses. Wind records should be reviewed with vibration, tilt, strain, displacement, pressure, access restrictions, and inspection timing. In exposed environments, maintenance teams also need to understand whether ice, salt, dust, or lightning may have affected the station. The environmental record becomes stronger when it shows both the weather condition and the reliability of the measurement point.
The environmental point should be part of a named monitoring question. It may explain wetting, drying, wind exposure, thermal movement, cabinet stress, or pressure variation, but that purpose needs to be visible in drawings and reports.
If the reading seems unusual, the team should check the physical condition of the station before drawing conclusions about the asset. Blockage, poor exposure, loose wiring, water entry, and changed surroundings can all create misleading patterns.
A practical report links the condition value with time, place, and action. It should help a reviewer decide whether to keep observing, inspect the field point, compare nearby instruments, or record the event as normal site behavior.
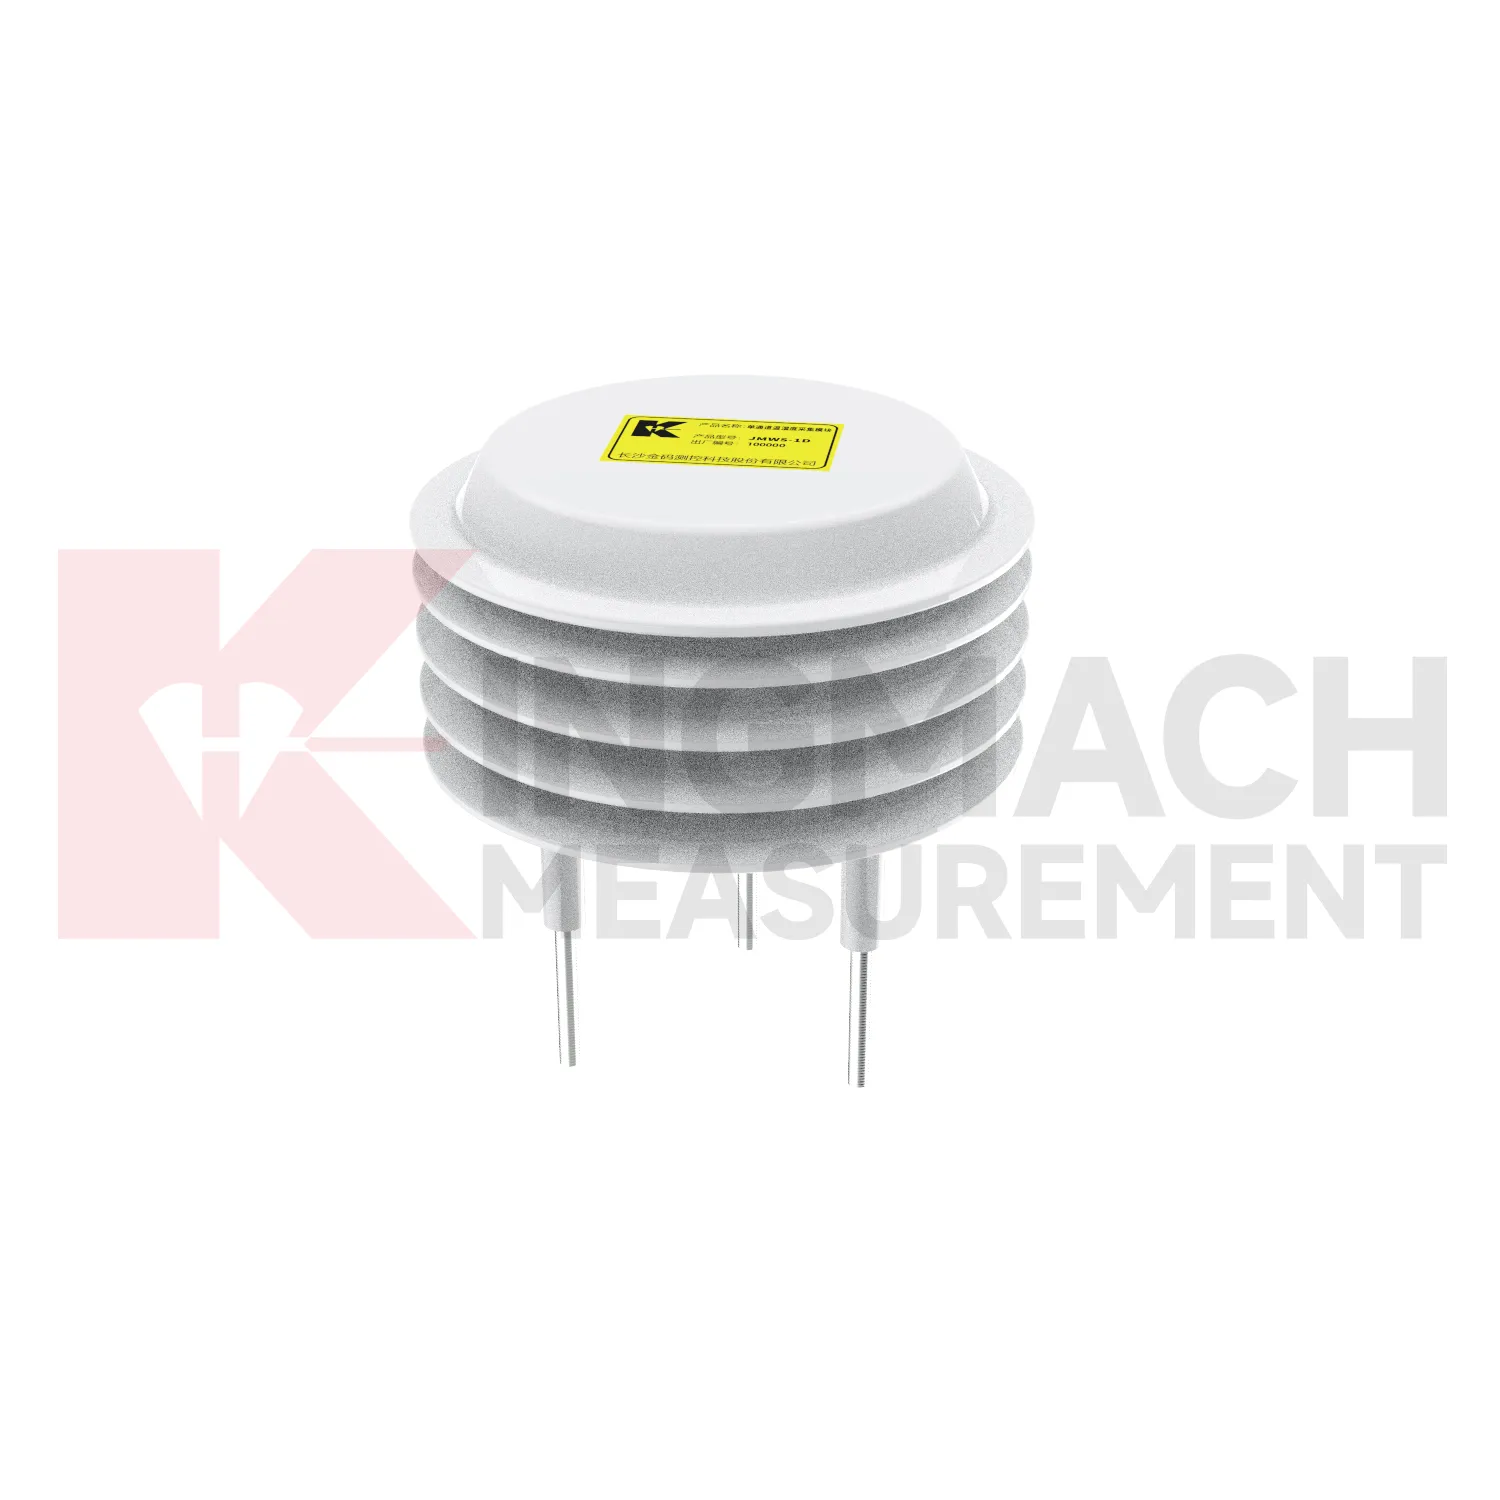
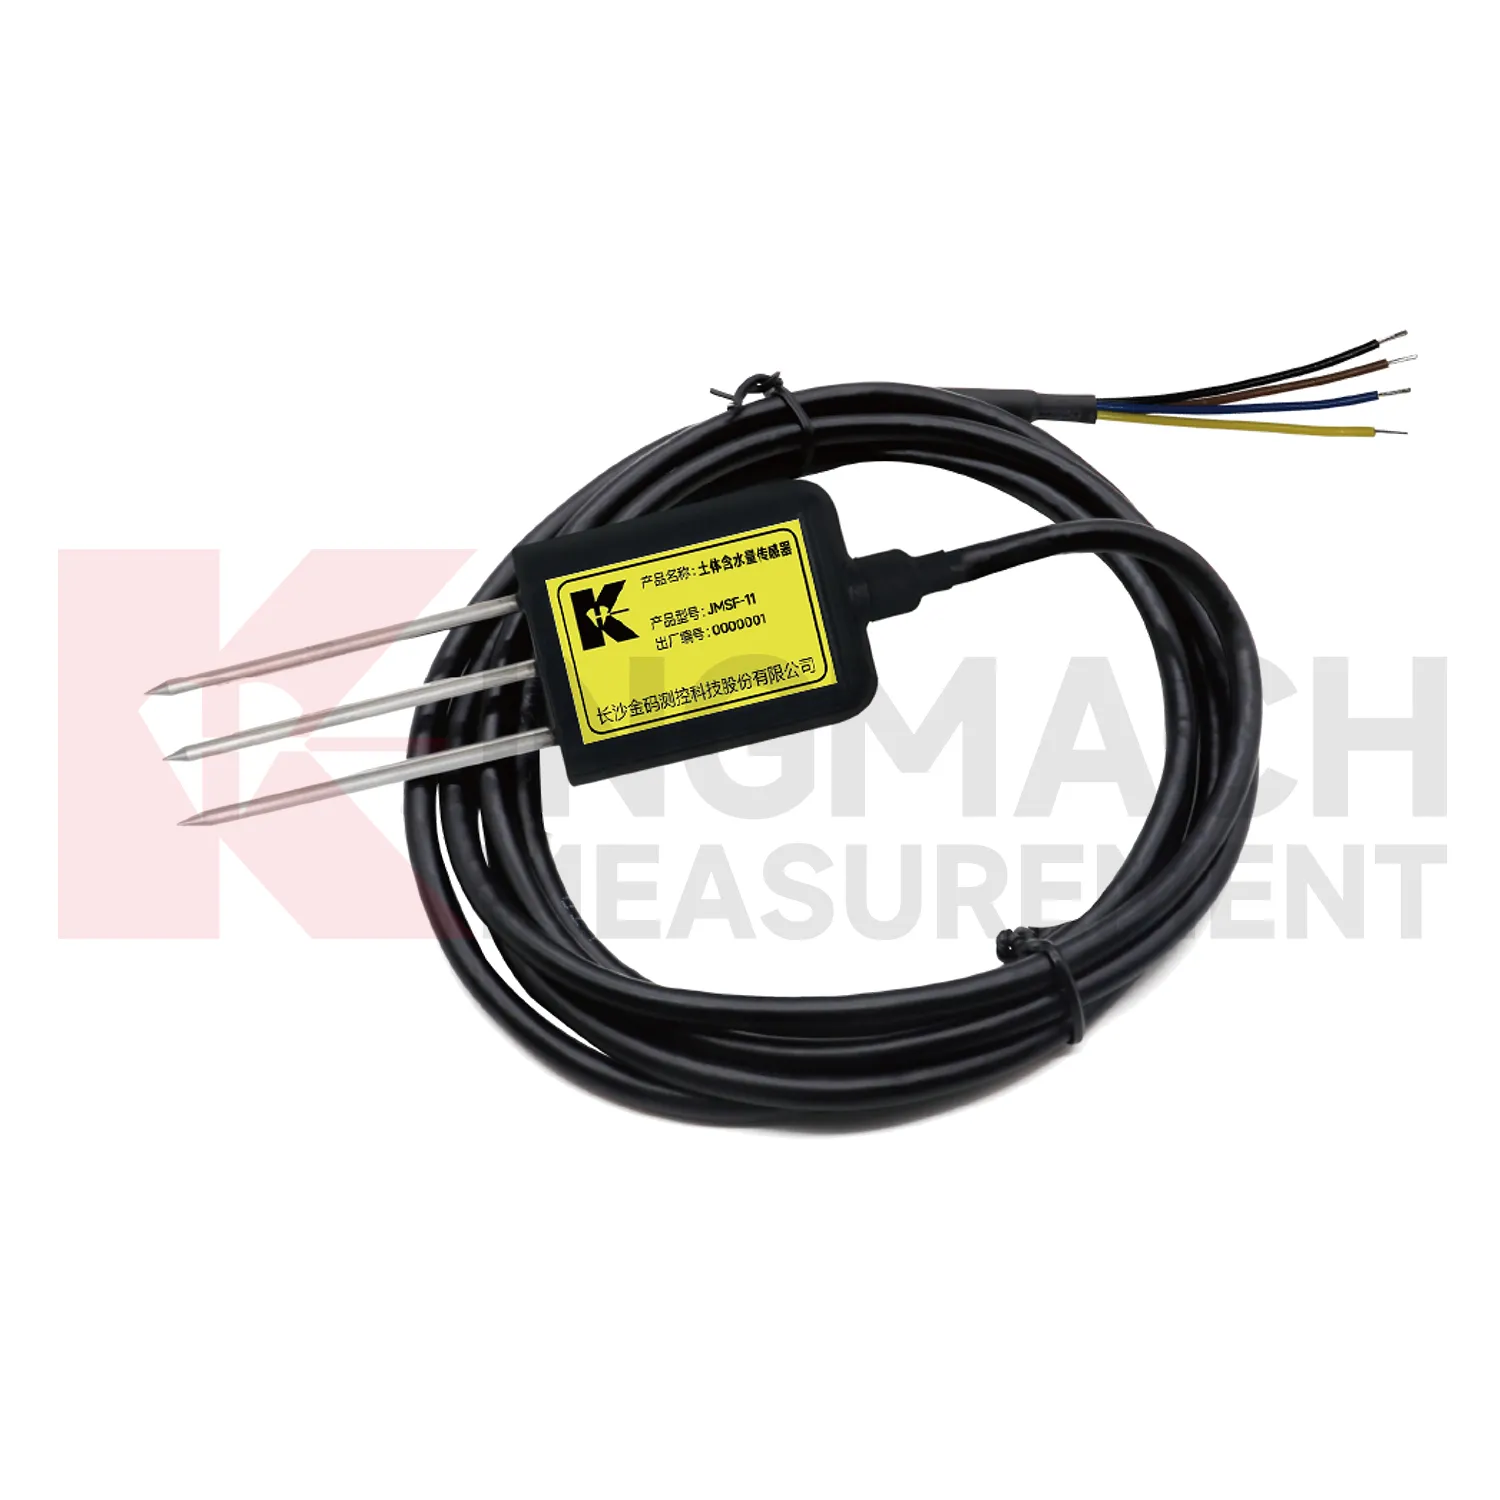
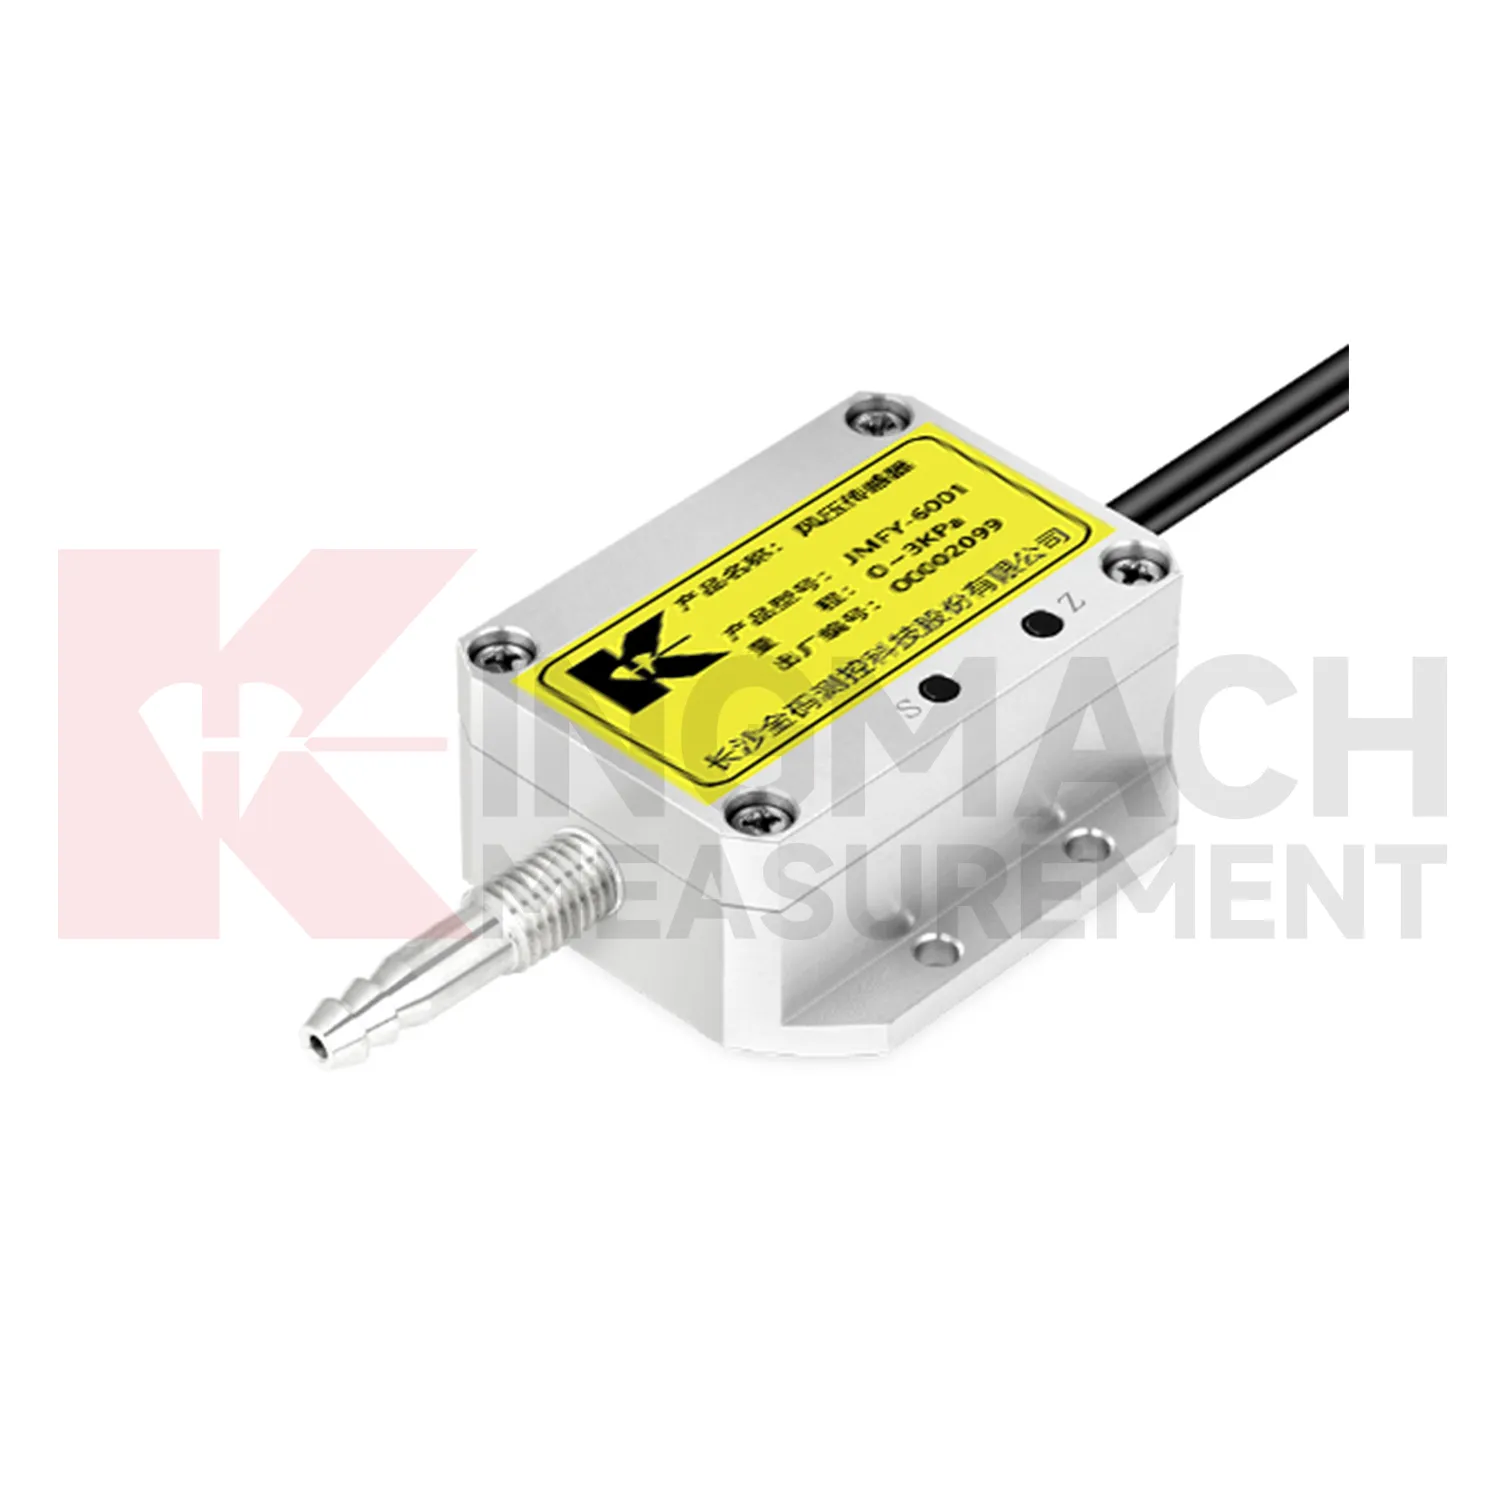
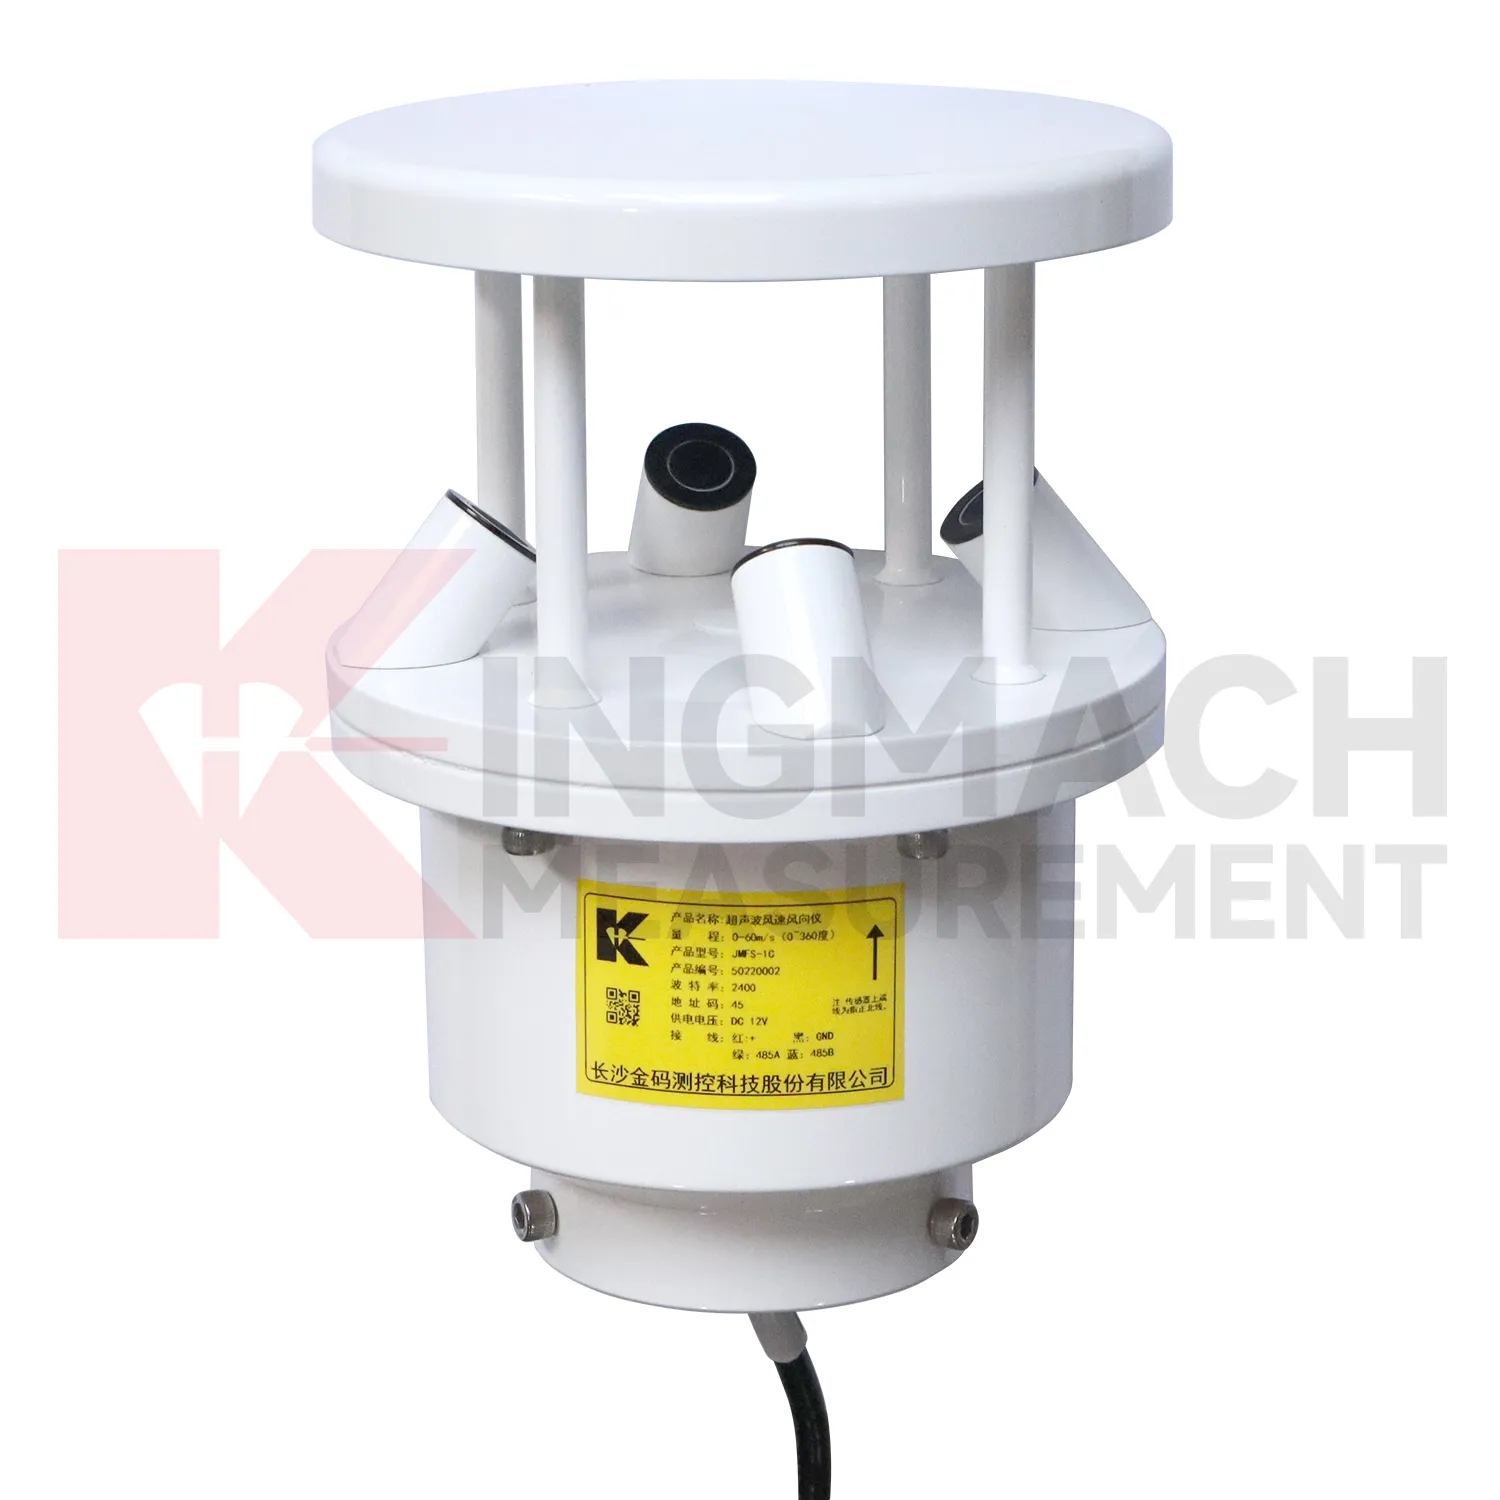
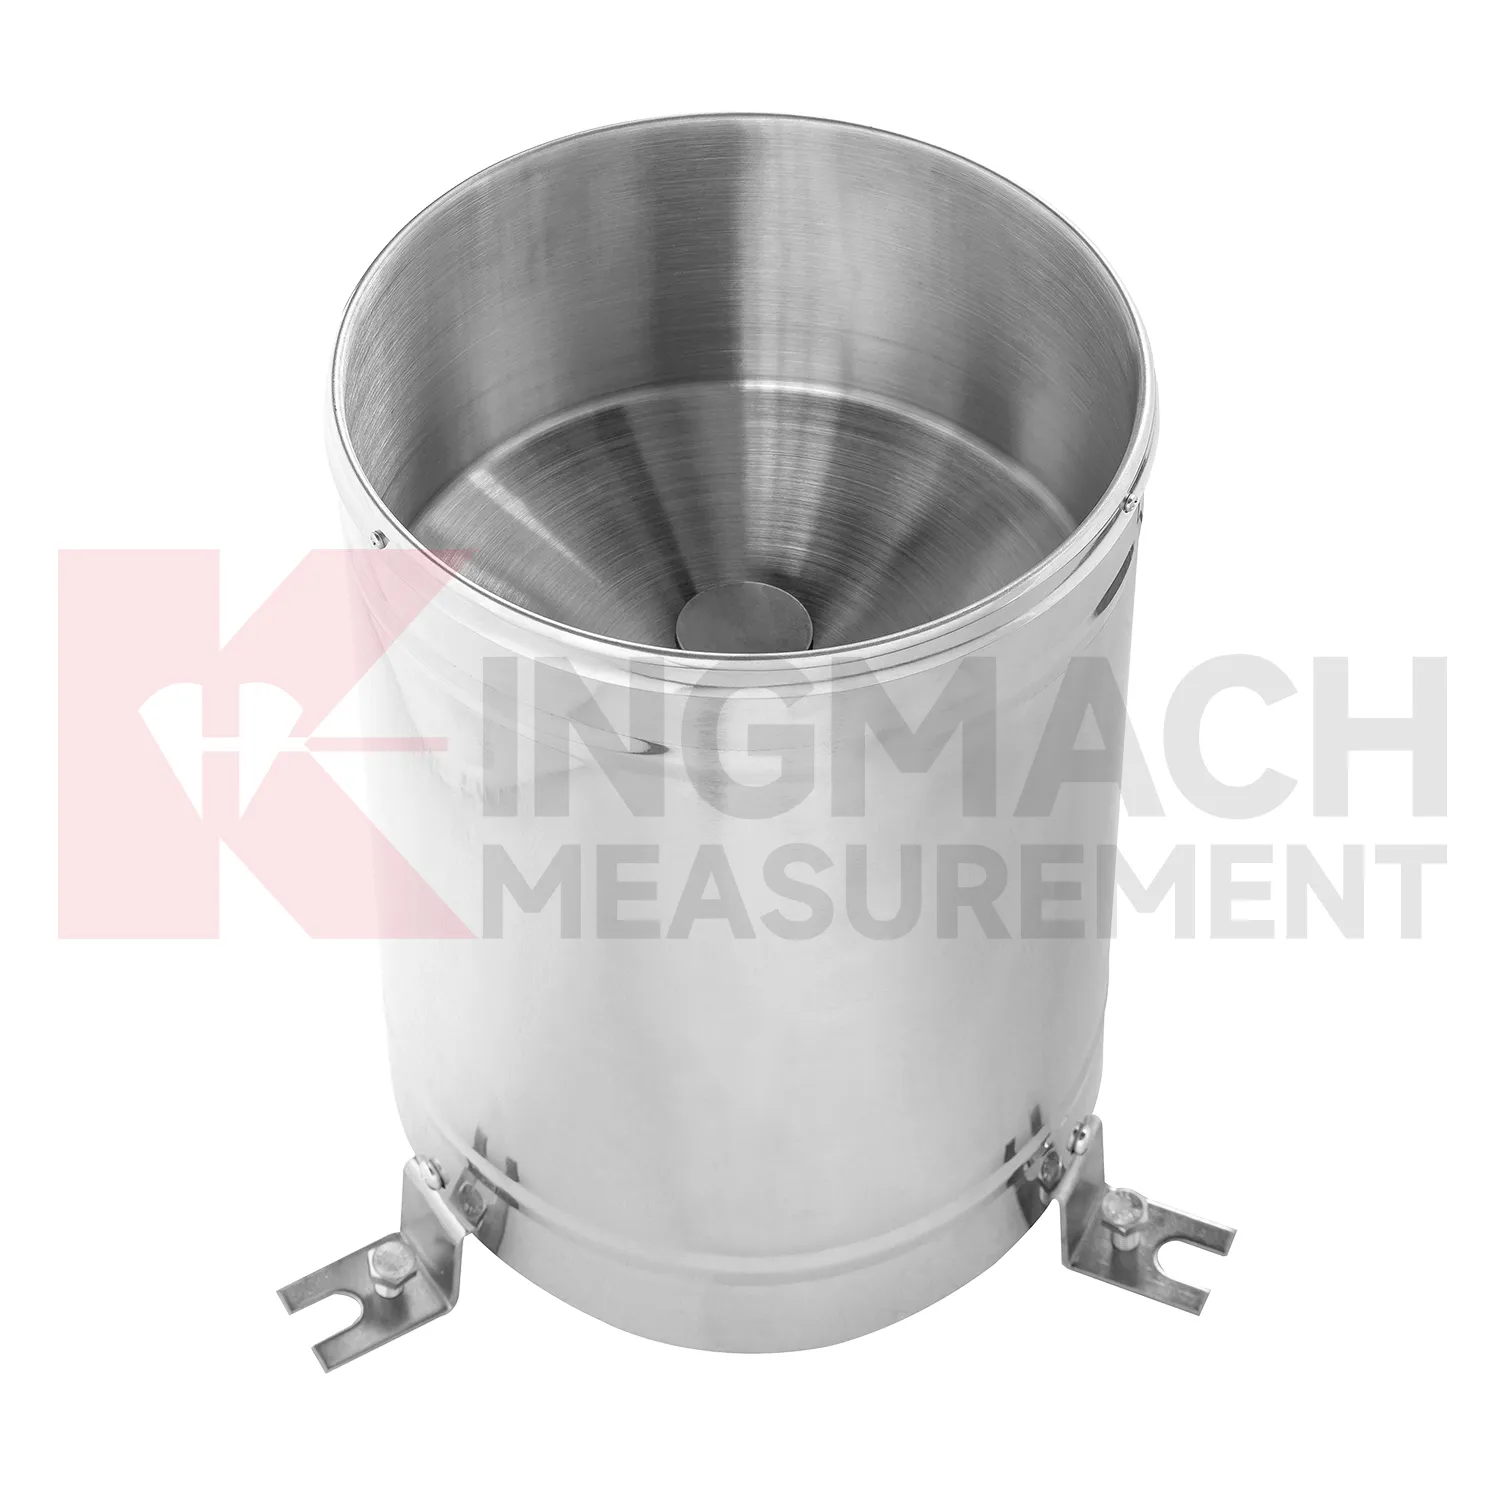
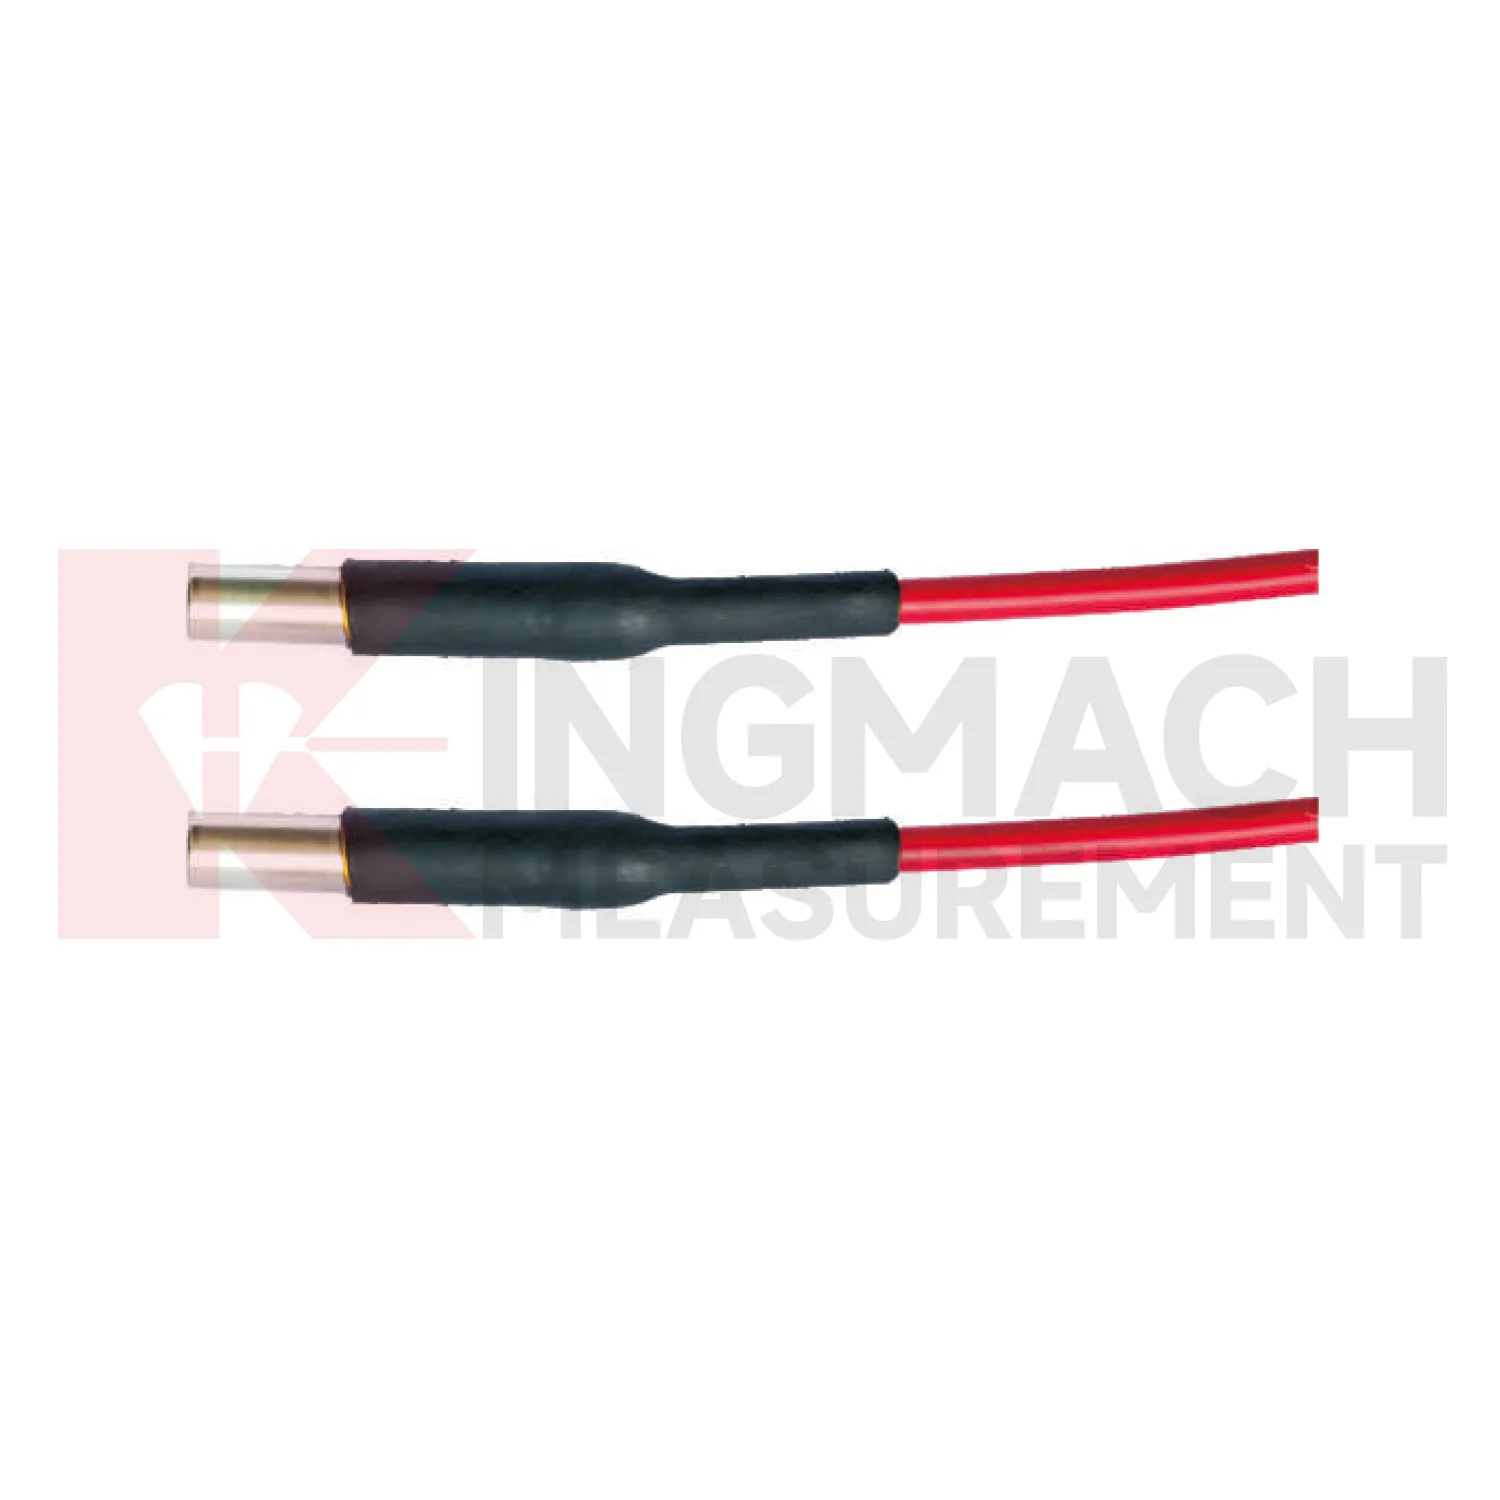
Application of Environmental Monitoring
Integrated monitoring platforms use Kingmach Environmental Monitoring as the condition layer beside structural instruments. A platform should not display environmental values as decoration. Each channel should support a review path: rainfall for slope and seepage behavior, wind for bridge and tower response, temperature for strain and expansion, humidity for cabinet reliability, pressure for airflow or wind load, and soil wetness for ground movement. Setup should define units, time alignment, alarm review, linked structural channels, and maintenance responsibilities. During an abnormal event, the reviewer should be able to compare the condition change with structural response without opening separate files. That is how environmental data becomes useful in daily operation, emergency review, and long-term asset management.
Platform design should group channels by risk rather than by instrument type. A bridge wind group, slope rainfall group, tunnel humidity group, or dam seepage group is easier for field staff to understand than a long list of unrelated values. This grouping also helps alarm review because the relevant condition and response appear together.
Permission and reporting workflows matter too. Designers may need detailed curves, maintenance staff may need station status, and owners may need a plain event summary. A well-organized platform lets each user see the environmental context needed for their decision.
The future of Environmental Monitoring
Water-driven geotechnical review will shape future Kingmach Environmental Monitoring. Slopes, embankments, dams, and foundation pits often respond to rain and wetting in delayed ways. Future reports can compare rainfall timing, wetting depth, deformation rate, pore pressure, seepage, and inspection observations. This will help engineers see whether the ground only reacted briefly or remained active after the weather event. It will also support more targeted site visits because the team can identify which area had both environmental change and structural response. Environmental data will become part of geotechnical reasoning rather than a weather appendix.
If the reading seems unusual, the team should check the physical condition of the station before drawing conclusions about the asset. Blockage, poor exposure, loose wiring, water entry, and changed surroundings can all create misleading patterns.
A practical report links the condition value with time, place, and action. It should help a reviewer decide whether to keep observing, inspect the field point, compare nearby instruments, or record the event as normal site behavior.
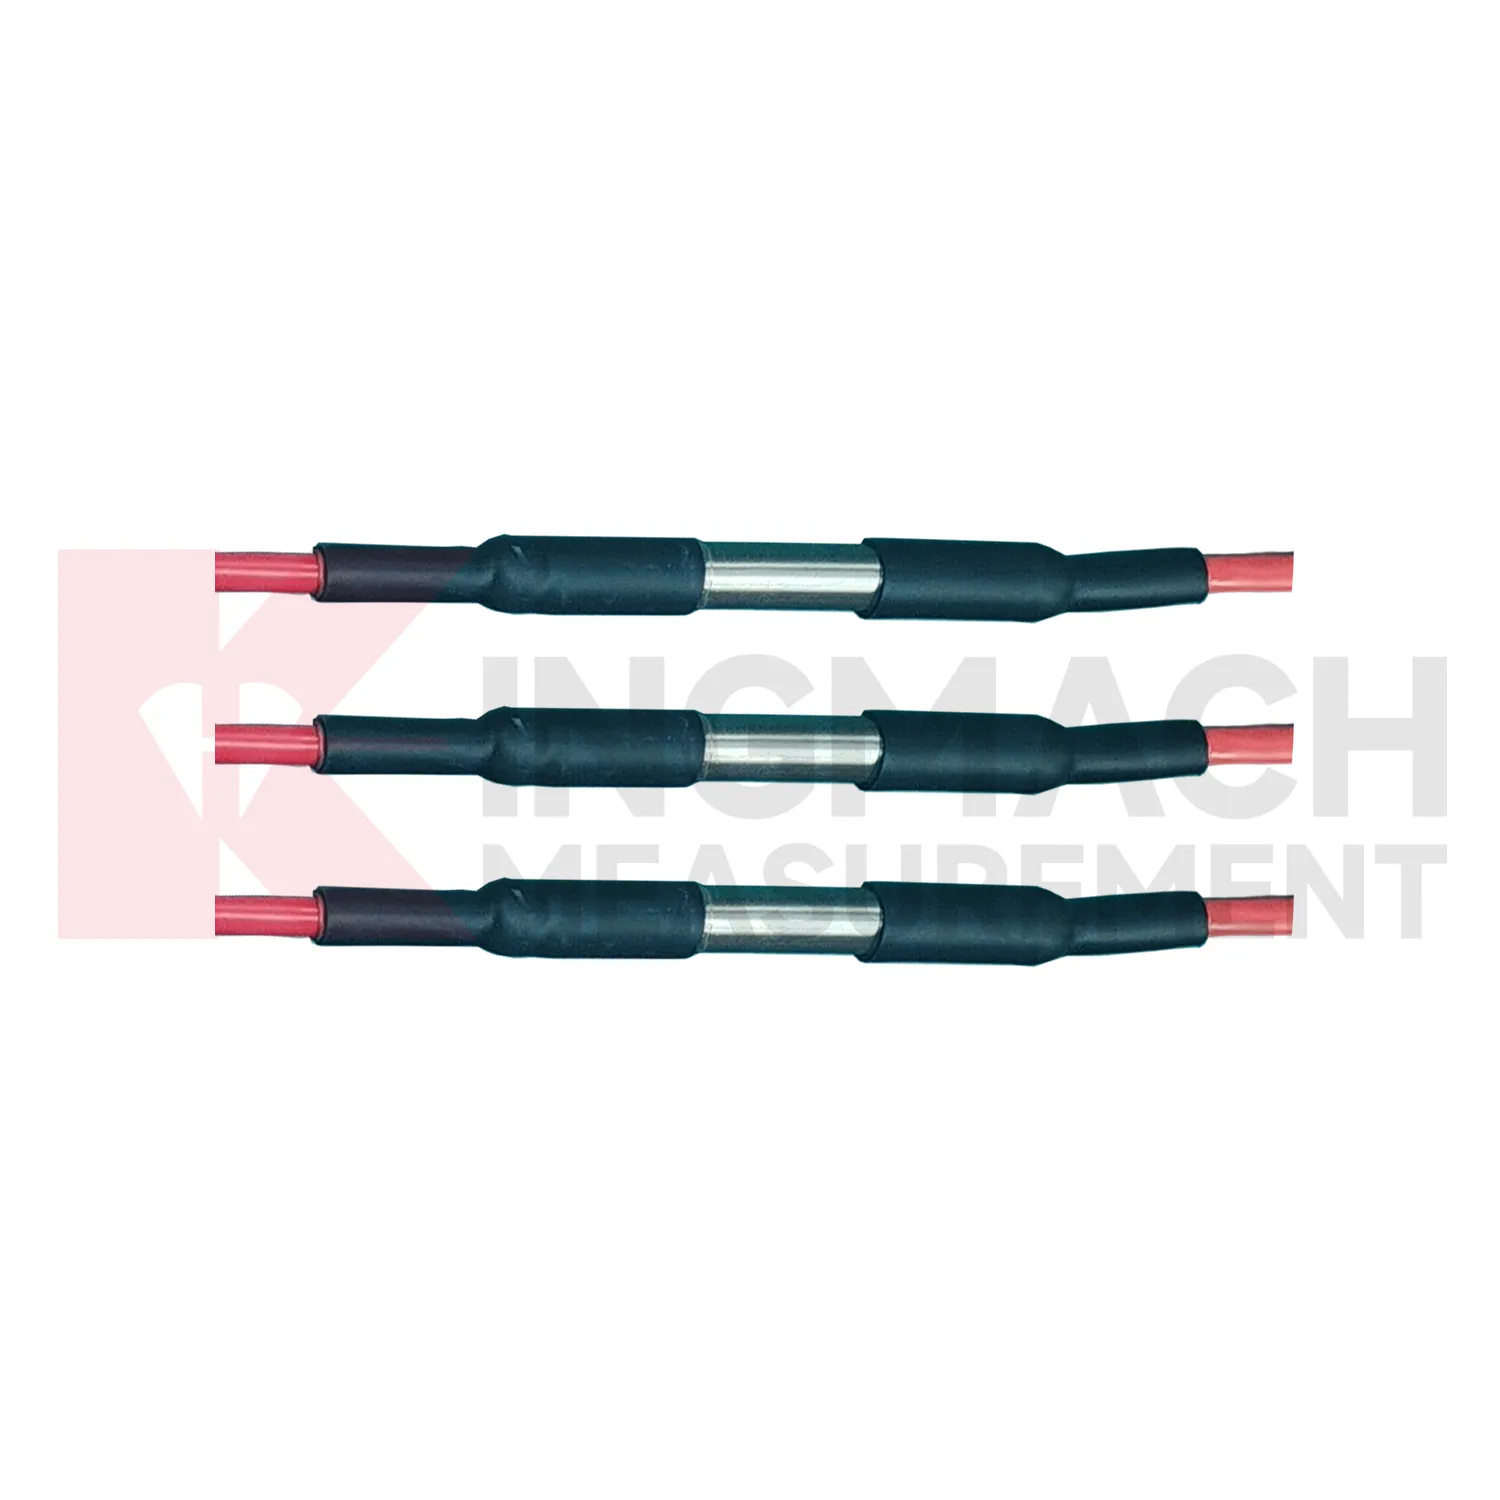
Care & Maintenance of Environmental Monitoring
Soil-condition maintenance for Kingmach Environmental Monitoring should protect the contact between the buried point and the surrounding material. Air gaps, disturbed soil, cable damage, excavation, animal activity, or water paths along the cable can all affect readings. Installation records should include depth, soil type, location photo, cable route, and first stable value. During review, compare soil wetness with rainfall, irrigation, groundwater, and nearby deformation. If a buried channel becomes flat or jumps suddenly, inspect cable continuity and recent site work before treating it as a real soil change. Buried points are easy to forget, so their maintenance history must be visible in the project file.
If the reading seems unusual, the team should check the physical condition of the station before drawing conclusions about the asset. Blockage, poor exposure, loose wiring, water entry, and changed surroundings can all create misleading patterns.
A practical report links the condition value with time, place, and action. It should help a reviewer decide whether to keep observing, inspect the field point, compare nearby instruments, or record the event as normal site behavior.
Kingmach Environmental Monitoring
Indoor and underground conditions are also part of Kingmach Environmental Monitoring. Temperature and humidity records in subways, tunnels, mines, shopping areas, construction rooms, and equipment cabinets can explain corrosion, condensation, sensor faults, and uncomfortable operating conditions. A monitoring cabinet may fail after a humidity rise. A tunnel section may show moisture patterns after rainfall or ventilation changes. A building floor may need air-condition context during vibration or structural testing. These records are not decorative dashboard values. They help maintenance teams know whether the environment is stressing instruments, structures, or working areas. Clear point names and stable placement are important because indoor conditions can change sharply over short distances.
A good review habit is to compare the condition channel with the nearest asset behavior instead of reading it as a standalone weather value. That keeps the record tied to slope movement, bridge response, tunnel equipment, dam seepage, drainage behavior, or cabinet reliability.
The installation file should explain why the location represents the monitored area. If the point is sheltered, shaded, exposed, buried, elevated, or placed inside an enclosure, that fact changes how later readings should be understood by maintenance staff.
FAQ
Q: What maintenance does Kingmach Environmental Monitoring need?
A: Maintenance includes cleaning, leveling, exposure checks, cable inspection, enclosure checks, unit verification, and data-quality review.
Q: What should be checked after storms?
A: Check rain catchment, cabinet water entry, cable damage, wind mounting, soil-point disturbance, and the first stable data after inspection.
Q: What causes misleading records?
A: Poor placement, blocked catchment, sheltered wind exposure, weak soil contact, water in cabinets, channel swaps, or missing maintenance notes can mislead reviewers.
Q: How often should inspections happen?
A: Frequency depends on exposure, asset risk, access, weather season, and how strongly the environmental data affects engineering decisions.
Q: How should replacement be handled?
A: Record the old and new condition, date, reason, point photo, channel change, and first stable value after replacement.
The environmental point should be part of a named monitoring question. It may explain wetting, drying, wind exposure, thermal movement, cabinet stress, or pressure variation, but that purpose needs to be visible in drawings and reports.
Reviews
Robert Taylor
The weir flow meter is well-built and delivers accurate measurements. Great value for water management applications.
James Thompson
The tiltmeters and accelerometers are very sensitive and provide precise data. Perfect for our structural health monitoring system.
Latest Inquiries
To protect the privacy of our buyers, only public service email domains like Gmail, Yahoo, and MSN will be displayed. Additionally, only a limited portion of the inquiry content will be shown.
Harper***@gmail.comIndia
Dear Sir, we are planning to procure a complete monitoring system including strain gauges, tiltmeter...
Isabella***@gmail.comGermany
Hello, we are evaluating weir flow meters for a water management project. Please share accuracy deta...
Related product categories
- Integrated Monitoring Station
- Soil Water Content Sensor
- Ultrasonic Anemometer
- semiconductor temperature sensor
- semiconductor based temperature sensors
- semiconductor temperature sensors
- semiconductor based temperature sensor
- semiconductor based ic temperature sensor
- semiconductor-based temperature sensors
- resistance temperature detector sensor
- resistive temperature sensor
- resistance temperature sensor